Matplotlib subplots with row titles
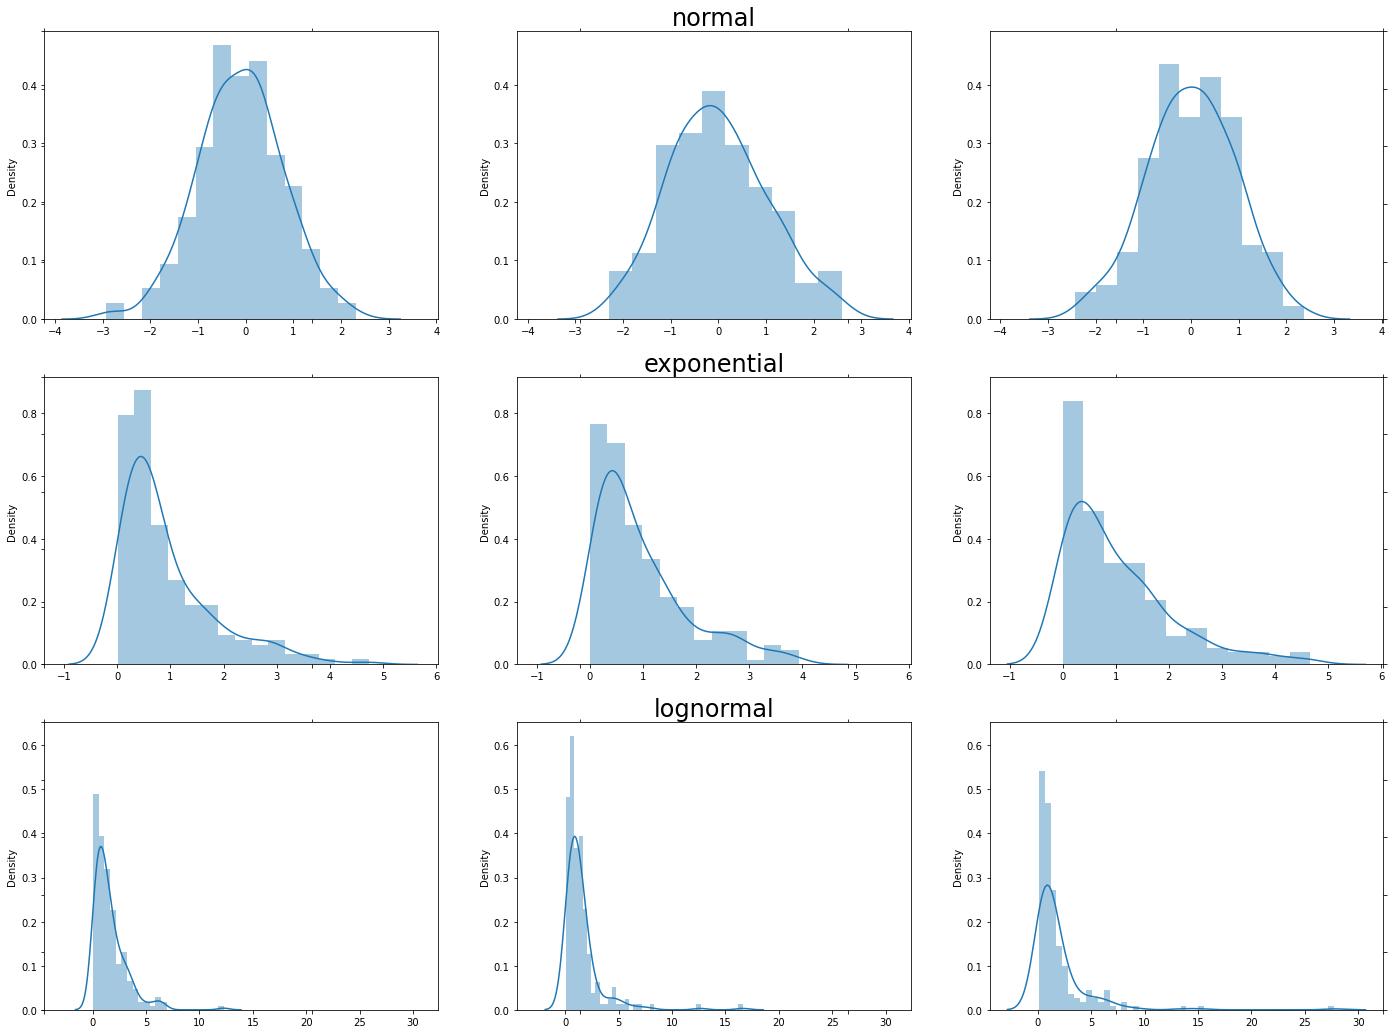
I’ve had to google for this enough times now to know I should just write a function. Sharing it here in case it saves others time. The code is a riff on matplotlib.pyplot.subplots() with an additional argument for row titles. It returns the same figure and axis array that subplots does with the row titles already included. The result looks like this:
Example usage:
import matplotlib.pyplot as plt
import seaborn as sns
import numpy as np

rows, cols = 3,3
row_to_fn = [np.random.normal, np.random.exponential, np.random.lognormal]
fig, axarr = subplots_with_row_titles(rows, cols, figsize=(cols*8, rows*6),
                                      row_titles=[f.__name__ for f in row_to_fn],
                                      row_title_kw=dict(fontsize=24),
                                      sharex='row')

for row in range(rows):
    for col in range(cols):
        ax = axarr[row, col]
        sns.distplot(row_to_fn[row](size=200), ax=ax)
def _get_share_ax(share_var, axarr, row, col):
    if share_var=='row':
        if col > 0:
            return axarr[row, col-1]
        return None
    elif share_var=='col':
        if row > 0:
            return axarr[row-1, col]
        return None
    elif share_var and (col>0 or row>0):
        return axarr[0,0]
    return None

def subplots_with_row_titles(nrows, ncols, row_titles=None, row_title_kw=None, sharex=False, sharey=False, subplot_kw=None, grid_spec_kw=None, **fig_kw):
    """
    Creates a figure and array of axes with a title for each row.

    Parameters
    ----------
    nrows, ncols : int
        Number of rows/columns of the subplot grid
    row_titles : list, optional
        List of titles for each row. If included, there must be one title for each row.
    row_title_kw: dict, optional
        Dict with kewords passed to the `~matplotlib.Axis.set_title` function.
        A common use is row_title_kw={'fontsize': 24}
    sharex, sharey : bool or {'none', 'all', 'row', 'col'}, default: False
        Controls sharing of properties among x (*sharex*) or y (*sharey*)
        axes:

        - True or 'all': x- or y-axis will be shared among all subplots.
        - False or 'none': each subplot x- or y-axis will be independent.
        - 'row': each subplot row will share an x- or y-axis.
        - 'col': each subplot column will share an x- or y-axis.

        When subplots have a shared x-axis along a column, only the x tick
        labels of the bottom subplot are created. Similarly, when subplots
        have a shared y-axis along a row, only the y tick labels of the first
        column subplot are created. To later turn other subplots' ticklabels
        on, use `~matplotlib.axes.Axes.tick_params`.
    subplot_kw : dict, optional
        Dict with keywords passed to the
        `~matplotlib.figure.Figure.add_subplot` call used to create each
        subplot.
    gridspec_kw : dict, optional
        Dict with keywords passed to the `~matplotlib.gridspec.GridSpec`
        constructor used to create the grid the subplots are placed on.
    **fig_kw
        All additional keyword arguments are passed to the
        `.pyplot.figure` call.
    """
    if row_titles is not None and len(row_titles) != nrows:
        raise ValueError(f'If row_titles is specified, there must be one for each row. Got={row_titles}')
    if subplot_kw is None:
        subplot_kw = {}
    if row_title_kw is None:
        row_title_kw = {}
    if sharex not in {True, False, 'row', 'col'}:
        raise ValueError(f'sharex must be one of [True, False, "row", "col"]. Got={sharex}')
    if sharey not in {True, False, 'row', 'col'}:
        raise ValueError(f'sharey must be one of [True, False, "row", "col"]. Got={sharey}')

    fig, big_axes = plt.subplots(nrows, 1, **fig_kw)
    for (row, big_ax) in enumerate(big_axes):
        if row_titles is not None:
            big_ax.set_title(str(row_titles[row]), **row_title_kw)
        big_ax.tick_params(labelcolor=(1.,1.,1., 0.0), top='off', bottom='off', left='off', right='off')
        big_ax._frameon = False

    axarr = np.empty((nrows, ncols), dtype='O')
    for row in range(nrows):
        for col in range(ncols):
            sharex_ax = _get_share_ax(sharex, axarr, row, col)
            sharey_ax = _get_share_ax(sharex, axarr, row, col)

            ax= fig.add_subplot(nrows, ncols, row*ncols+col+1,
                                sharex=sharex_ax, sharey=sharey_ax, **subplot_kw)
            axarr[row, col] = ax
    return fig, axarr
This code was adapted from https://stackoverflow.com/questions/27426668/row-titles-for-matplotlib-subplot.
Please send any thoughts, questions and feedback to wyegelwel at gmail.com or on twitter @wyegelwel